Data visualization
Contents
9.6. Data visualization#
9.6.1. Scientific data visualization in Matplotlib#
Scientific Visualization: Python + Matplotlib will put any other plotting library to shame (ok, maybe not d3.js).
The Matplotlib techniques and plots shown in the book will be, beyond doubt, some of the best visual arts you’ve ever seen.
The book covers:
✅ Anatomy of Matplotlib ✅ Animation ✅ 3D visuals ✅ Polar coordinates ✅ Custom plot types
The book is written by one of the core contributors of Matplotlib - Nicolas Rougier.
Read it for free here: https://bit.ly/3baeMlZ
9.6.2. data-to-viz.com#
Become a data visualization wizard!
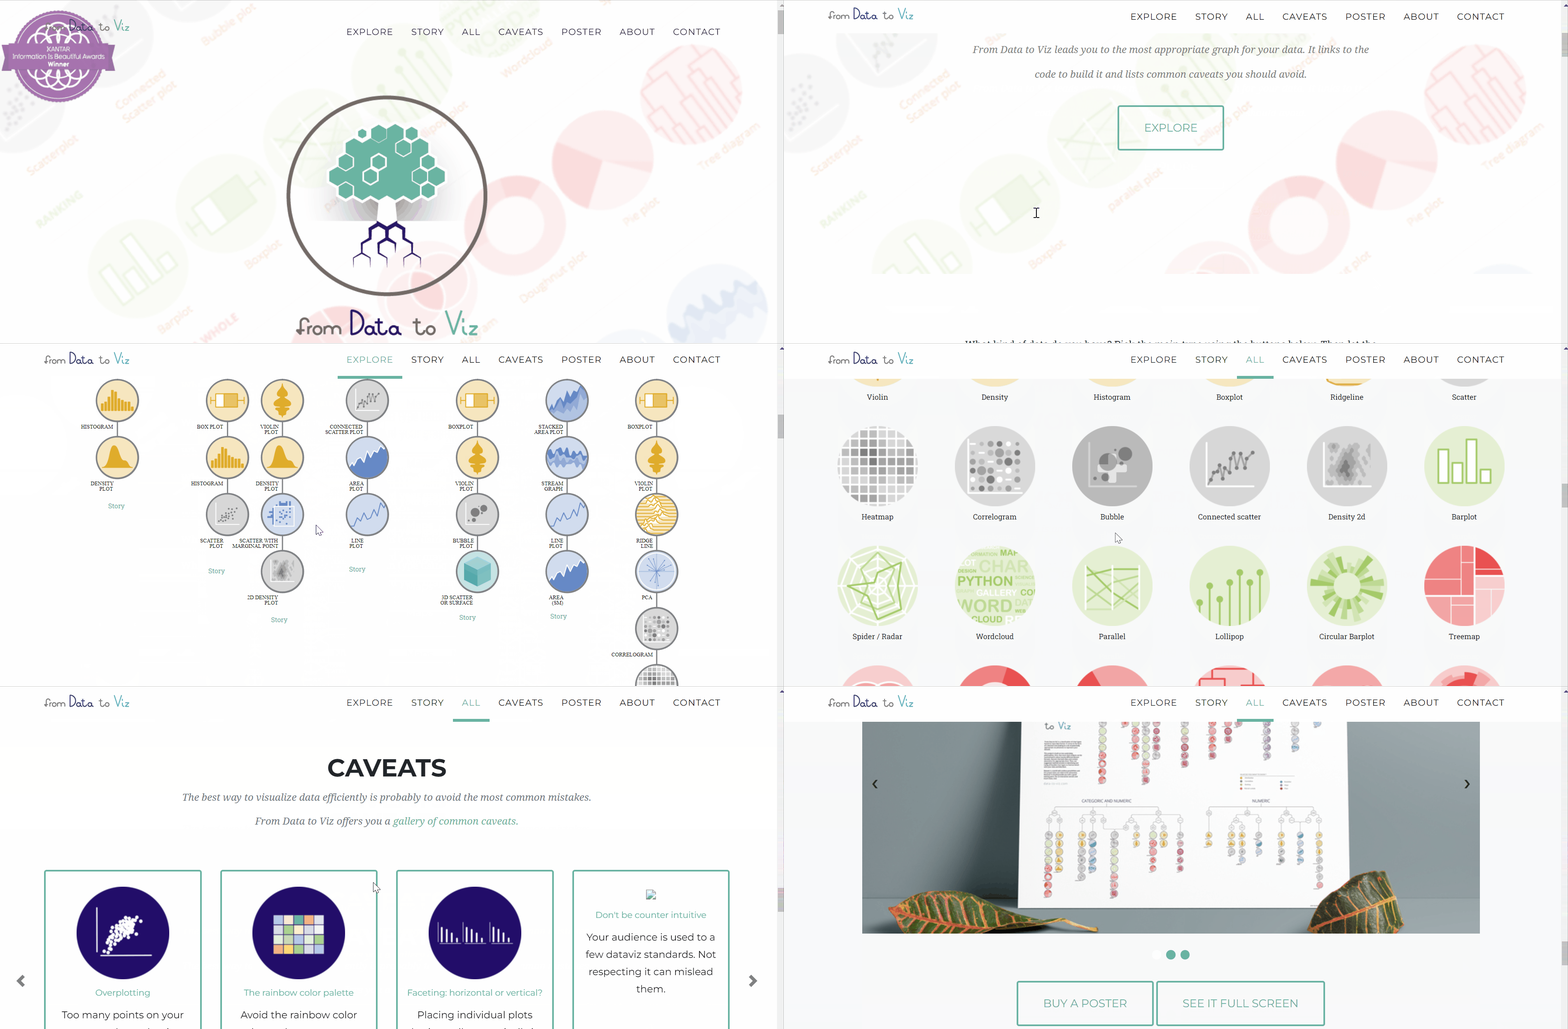
Data to Viz is a masterpiece of a platform for anyone trying to convey data insights in the best way possible.
It lets you choose the most appropriate chart for your data, shows you the code to do it and highlights how to avoid common pitfalls while plotting that chart.
Its library contains almost 40 types of visuals, sorted by purpose and data type.
Check out the platform from the link below👇

Link: https://www.data-to-viz.com/
9.6.3. Lovely Matplotlib Plots GitHub - library#
How to make Matplotlib default styles unsuck, so you can boldly use the library anywhere? Use the “ipynb” style.
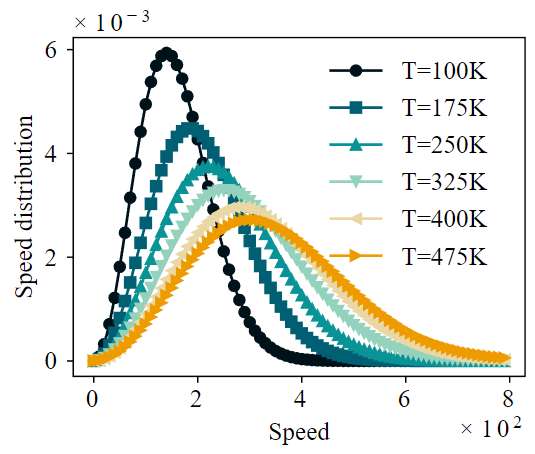
LovelyPlots is a package that loads a new “ipynb” Matplotlib them into the installation. The purpose of this theme is to convert horrendous default Matplotlib styles to publication-level format for scientific paper, thesis and presentations.
Just install it with “pip install LovelyPlots” and write “ply.style.use(‘ipynb’)”


