Other cool dataviz libraries
Contents
3.3. Other cool dataviz libraries#
3.3.1. PyBaobab for much better decision tree visualizations#
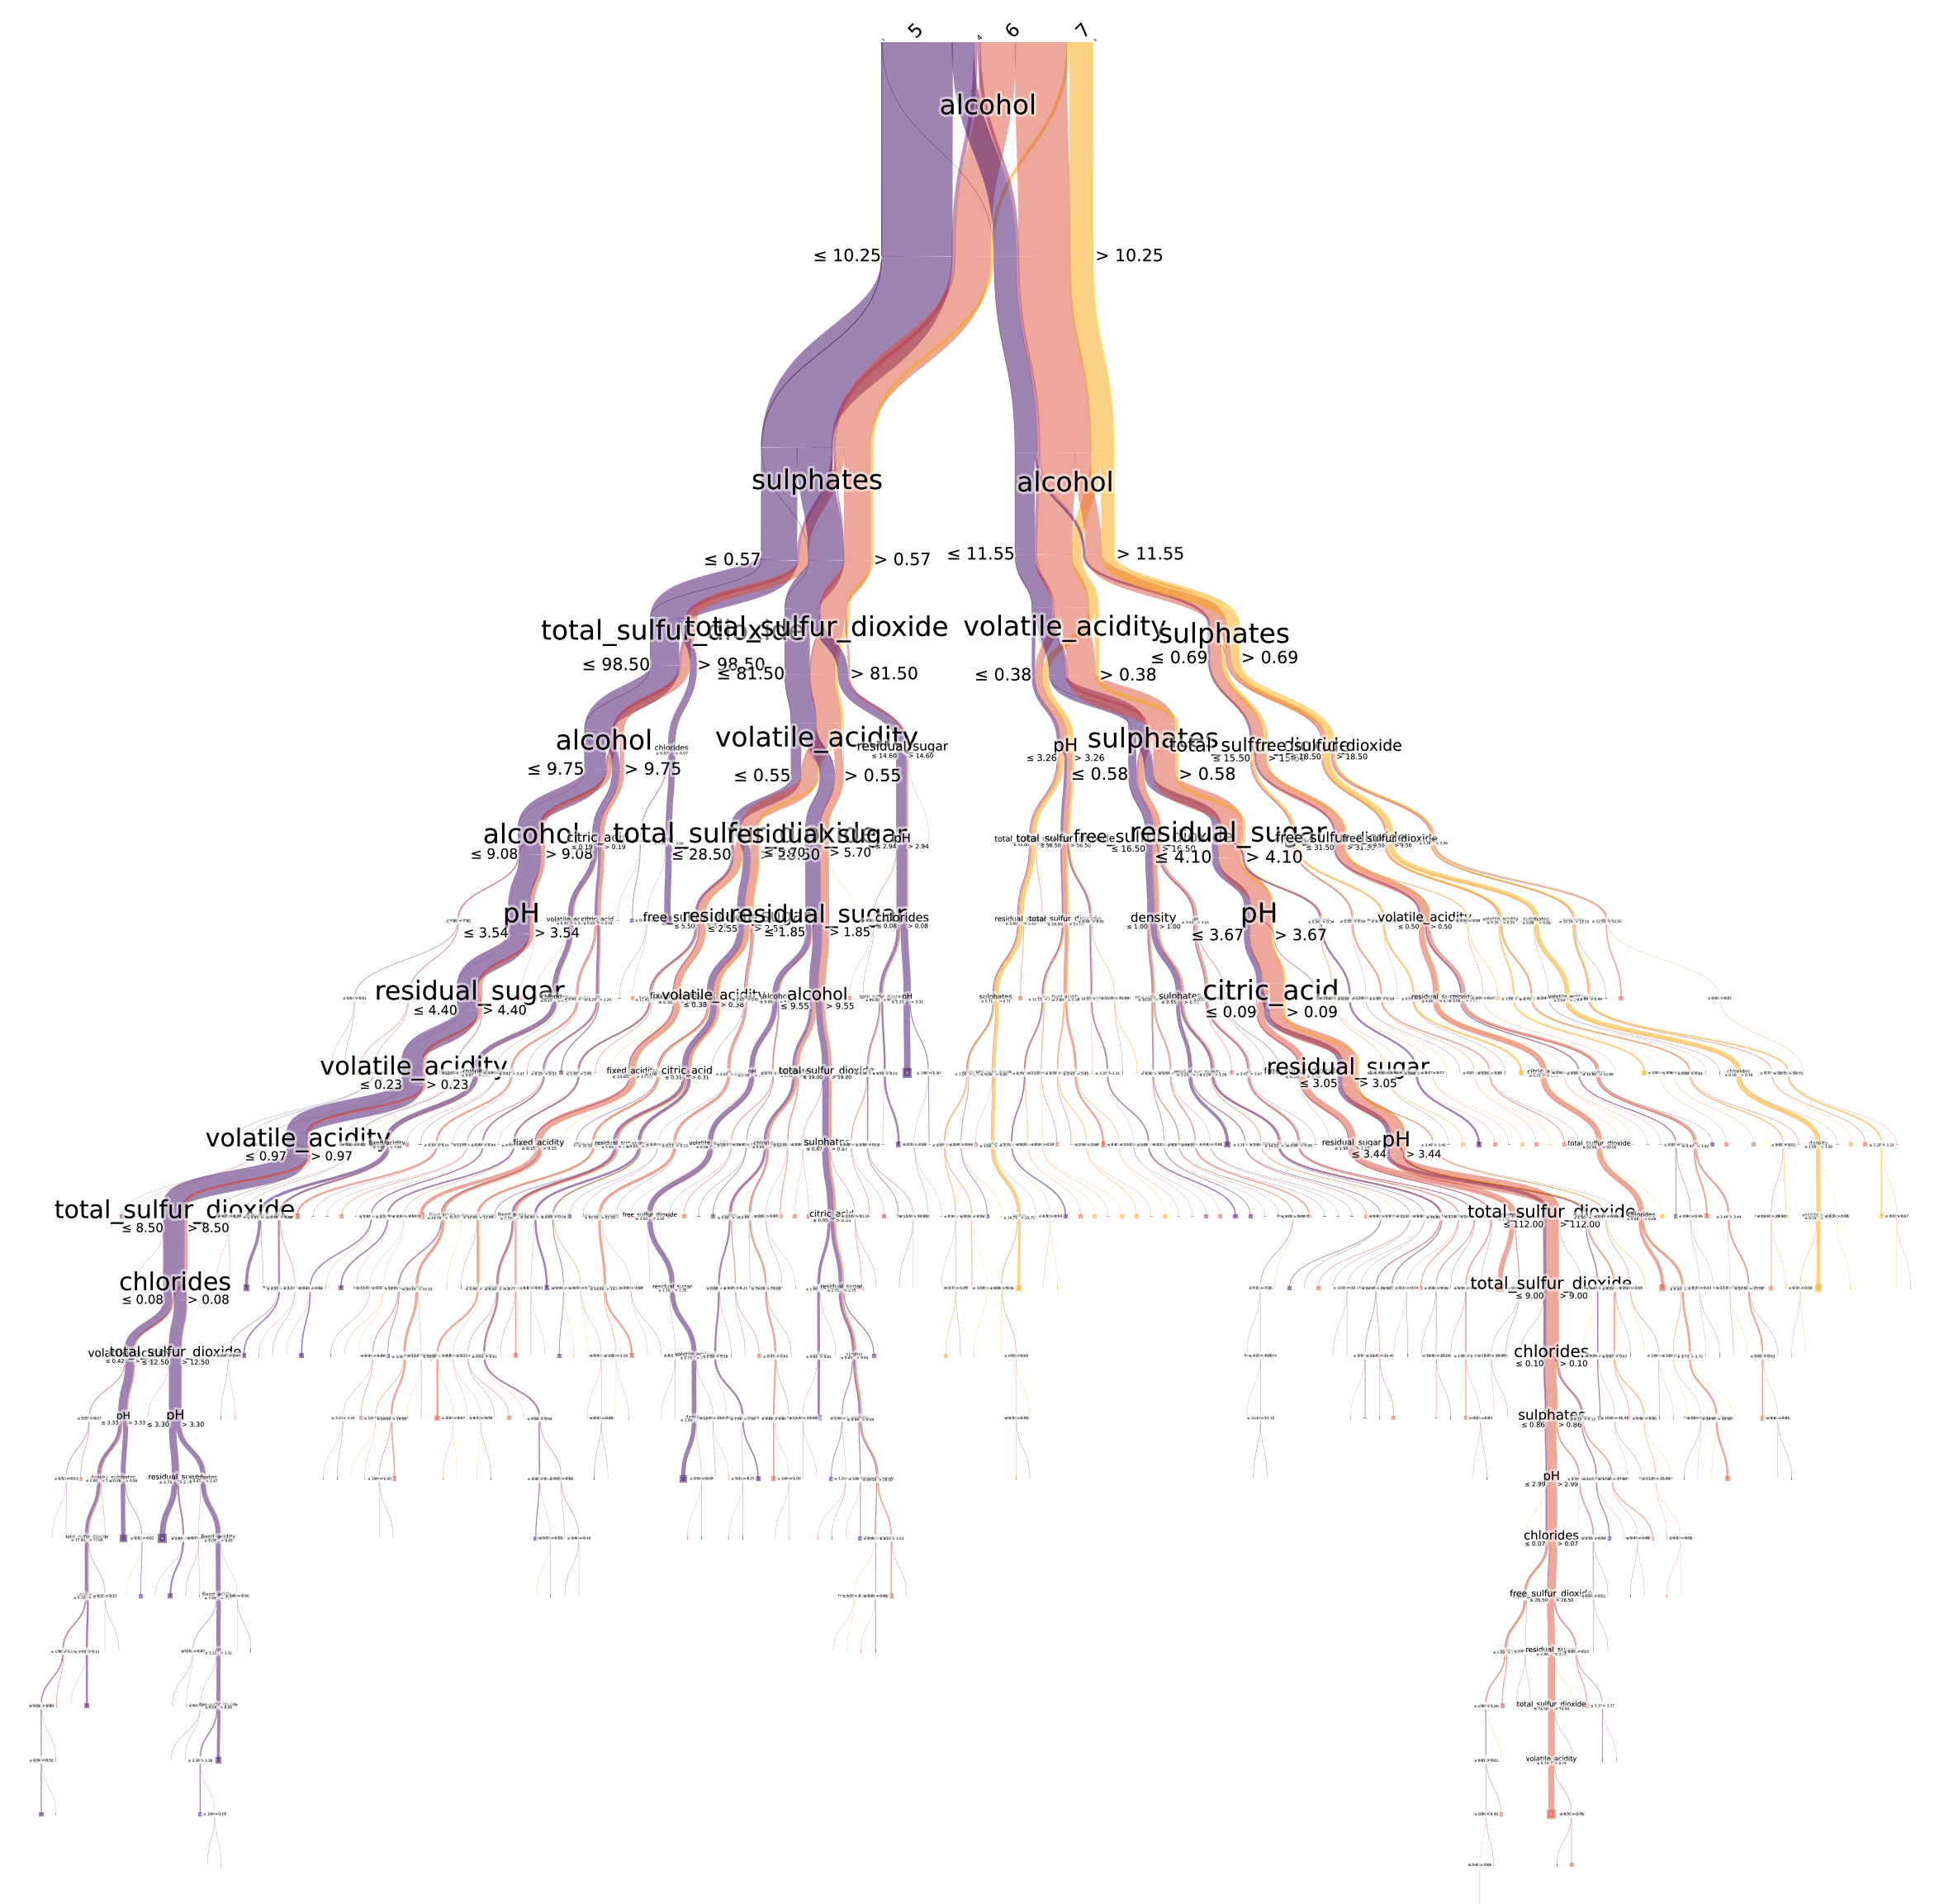
PyBaobabdt is a wonderful Python package to visualize decision trees using Sankey diagrams. For a tree classifier, each class is represented with a color, and the width of each link (or root) represents the number of samples in each class.
The trees can become as beautiful as you want by controlling the max_depth parameter.
The link to the package in the comments👇

3.3.2. Print the prediction path of a sample#
You can visualize the prediction path of a datapoint in a decision tree using the dtreeviz package. Adding one or two plots like below to your analysis will give viewers a better sense of how predictions are made using decision trees.
Link to dtreeviz in the comments👇
Link to dtreeviz: https://bit.ly/3nDk2la
3.3.3. Mlextend - plot decision boundaries of classifiers#
One of the most fun things you can do with your classifier is plot its decision boundaries. But, you will quickly realize that the code to generate such a plot is, put mildly, a giant pain in the keyboard.
Fortunately, the mlextend package collapses all that code into a function, so that you can draw decision boundaries of any classifier in a single line of code👇

